Post updated 2014 January 2nd
DNA methylation is a biochemical process and epigenetic modification, whereby a methyl group is added to the cytosine nucleotide (and also adenine) to form 5-methylcytosine. DNA methylation at the 5' position of cytosine has the specific effect of reducing gene transcription and typically occurs in CpG sites, which are regions of DNA where a cytosine occurs next to a guanine (the p stands for the phosphate link that links them together). Most CpGs are methylated in mammals, however, unmethylated CpGs are often grouped in clusters called CpG islands, which are present in the 5' regulatory regions of many genes.
One way of profiling methylation patterns in DNA is via the use of bisulphite treatment of DNA following by sequencing, which is known as bisulphite sequencing. The treatment of DNA with bisulphite converts cytosine residues to uracil, but leaves 5-methylcytosine residues unaffected. Therefore after sequencing, cytosine residues represent methylated cytosines in the genome. One variant of bisulphite sequencing, is reduced representation bisulphite sequencing (RRBS), which was developed as a cost-efficient method to profile areas of the genome that have a high CpG content. Genomic DNA is digested using the restriction endonuclease MspI, which recognises the sequence 5'-CCGG-3'. MspI is actually part of a isoschizomer pair with HpaII, which are restriction enzymes that are specific to the same recognition sequence. However MspI can recognise methylated cytosines, whereby HpaII cannot.
     MspI site               MspI site
5'-...CCGGNNNNNNNNNNNNNNNNNNNNNCCGG...-3'
3'-...GGCCNNNNNNNNNNNNNNNNNNNNNGGCC...-5'

             MspI digestion

5'-    CGGNNNNNNNNNNNNNNNNNNNNNC      -3'
3'-      CNNNNNNNNNNNNNNNNNNNNNGGC    -5'
The ENCODE project generated a lot of RRBS data for different samples and two whole genome bisulphite sequencing (WGBS) datasets on H1hESC and GM12878. This thread on Nature aggregated the DNA methylation papers published as part of ENCODE.
The ENCODE reduced-representation bisulphite sequencing (RRBS) methylation data can be found at this URL:
http://hgdownload.cse.ucsc.edu/goldenPath/hg19/encodeDCC/wgEncodeHaibMethylRrbs/
I will use the RRBS data on the K562 cell line and the H1hESC cell line.
#download the files
wget http://hgdownload.cse.ucsc.edu/goldenPath/hg19/encodeDCC/wgEncodeHaibMethylRrbs/wgEncodeHaibMethylRrbsK562HaibSitesRep1.bed.gz
wget http://hgdownload.cse.ucsc.edu/goldenPath/hg19/encodeDCC/wgEncodeHaibMethylRrbs/wgEncodeHaibMethylRrbsK562HaibSitesRep2.bed.gz
For more information on these tracks, use the UCSC Genome Browser search page, then click on "Track search" under "Search Human Genome GRCh37/hg19" and in the "Track Name" box type "Methyl-RRBS" and for "Cell, tissue or DNA sample", select K562. You should get two results; clicking on "K562 1" will give you the full description of these files.
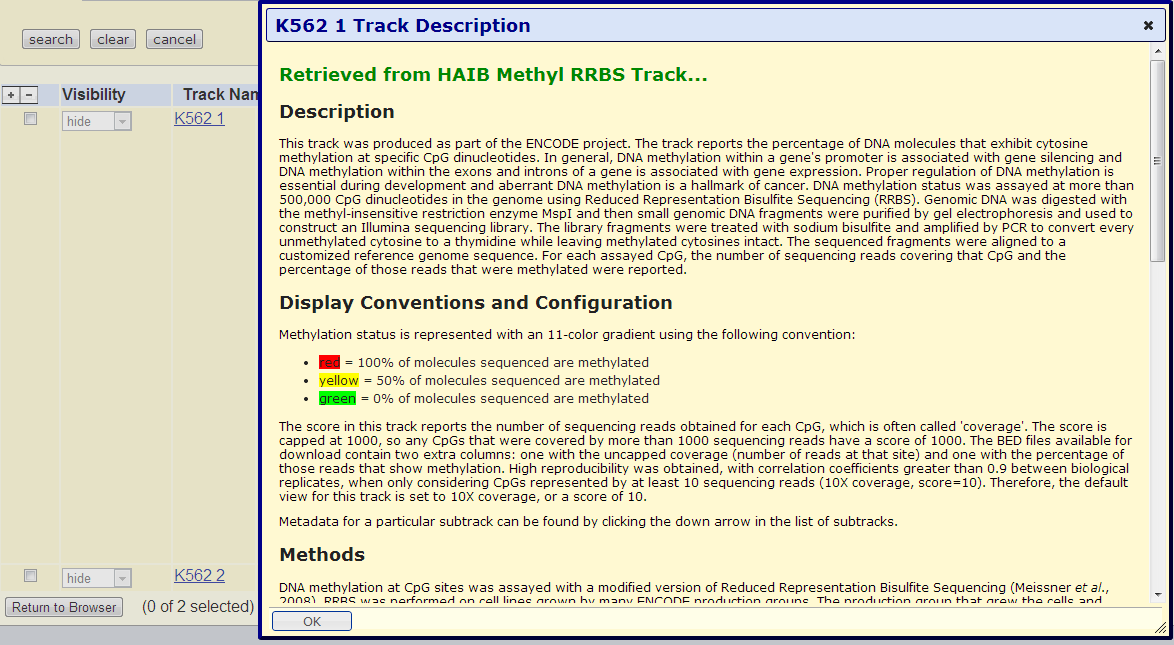
From the "Display Conventions and Configuration" section it reads:
The BED files available for download contain two extra columns: one with the uncapped coverage (number of reads at that site) and one with the percentage of those reads that show methylation. High reproducibility was obtained, with correlation coefficients greater than 0.9 between biological replicates, when only considering CpGs represented by at least 10 sequencing reads (10X coverage, score=10). Therefore, the default view for this track is set to 10X coverage, or a score of 10.
If we look into the file, we can see the typical BED columns (1-9) and the two additional columns (10-11):
chr	start	end	name            score   strand  tStart  tEnd    rgb             count   percentMeth
chr1	10785	10786	K562_Rep3_RRBS	4	+	10785	10786	255,0,0         4	100
chr1	88704	88705	K562_Rep3_RRBS	3	+	88704	88705	255,155,0	3	67
chr1	137976	137977	K562_Rep3_RRBS	35	+	137976	137977	255,55,0	35	94
So at position chr1:10785-10786, all 4 reads were methylated and at position chr1:88704-88705, 2 of the 3 reads were methylated. Let's calculate some simple statistics:
#how many profiled positions in the first replicate
zcat wgEncodeHaibMethylRrbsK562HaibSitesRep1.bed.gz | grep -v "^track" | wc -l
1275818

#how many profiled positions with at least 10 sequencing reads?
zcat wgEncodeHaibMethylRrbsK562HaibSitesRep1.bed.gz | grep -v "^track" | awk '$5>9 {print}' | wc -l
808212

#what is the distribution of read counts at
#each profiled position?
zcat wgEncodeHaibMethylRrbsK562HaibSitesRep1.bed.gz | grep -v "^track" | cut -f10 | stats
Total lines:            1275818
Sum of lines:           45676252
Ari. Mean:              35.8015422262423
Geo. Mean:              13.4023455040408
Median:                 21
Mode:                   1 (N=208629)
Anti-Mode:              382 (N=1)
Minimum:                1
Maximum:                32552
Variance:               34252.6155229694
StdDev:                 185.074621498923

#what is the distribution of methylation percentage?
zcat wgEncodeHaibMethylRrbsK562HaibSitesRep1.bed.gz | grep -v "^track" | cut -f11 | stats
Total lines:            1275818
Sum of lines:           37255124
Ari. Mean:              29.2009706713654
Geo. Mean:              undef (zero found in data)
Median:                 4
Mode:                   0 (N=554420)
Anti-Mode:              34 (N=1418)
Minimum:                0
Maximum:                100
Variance:               1514.74526361253
StdDev:                 38.9197284627287
So for the first replicate of the K562 RRBS dataset (wgEncodeHaibMethylRrbsK562HaibSitesRep1.bed.gz), 1,275,818 sites were profiled (808,212 with 10 reads or more) and the median distribution of reads sequenced was 21 and the median methylation percentage was 4.
Let's compare this to human embryonic stem cells:
wget http://hgdownload.cse.ucsc.edu/goldenPath/hg19/encodeDCC/wgEncodeHaibMethylRrbs/wgEncodeHaibMethylRrbsH1hescHaibSitesRep1.bed.gz

#profiled sites
zcat wgEncodeHaibMethylRrbsH1hescHaibSitesRep1.bed.gz | grep -v "^track" | wc -l
1288079

#profiled sites with >=10 reads
zcat wgEncodeHaibMethylRrbsH1hescHaibSitesRep1.bed.gz | grep -v "^track" | awk '$5>9 {print}' | wc -l
713920

#distribution of read counts
zcat wgEncodeHaibMethylRrbsH1hescHaibSitesRep1.bed.gz | grep -v "^track" | cut -f10 | stats
Total lines:            1288079
Sum of lines:           28218867
Ari. Mean:              21.9077145112994
Geo. Mean:              9.53485643942492
Median:                 12
Mode:                   1 (N=204533)
Anti-Mode:              247 (N=1)
Minimum:                1
Maximum:                18154
Variance:               11753.75583868
StdDev:                 108.414739951171

#distribution of percentage methylation
zcat wgEncodeHaibMethylRrbsH1hescHaibSitesRep1.bed.gz | grep -v "^track" | cut -f11 | stats
Total lines:            1288079
Sum of lines:           42226713
Ari. Mean:              32.782704321707
Geo. Mean:              undef (zero found in data)
Median:                 2
Mode:                   0 (N=601926)
Anti-Mode:              51 (N=91)
Minimum:                0
Maximum:                100
Variance:               1873.49808066919
StdDev:                 43.2839240442591
Statistics via R
Calculating some statistics and making plots using R:
data <- read.table(gzfile("wgEncodeHaibMethylRrbsH1hescHaibSitesRep1.bed.gz"),
                   header=F,
                   skip=1)
head(data)
#    V1      V2      V3         V4 V5 V6      V7      V8        V9 V10 V11
#1 chr1 1000170 1000171 SL716_RRBS 41  + 1000170 1000171 255,105,0  41  83
#2 chr1 1000190 1000191 SL716_RRBS 41  + 1000190 1000191 255,105,0  41  80
#3 chr1 1000191 1000192 SL716_RRBS 24  - 1000191 1000192 255,105,0  24  75
#4 chr1 1000198 1000199 SL716_RRBS 41  + 1000198 1000199   255,0,0  41  98
#5 chr1 1000199 1000200 SL716_RRBS 24  - 1000199 1000200  255,55,0  24  92
#6 chr1 1000206 1000207 SL716_RRBS 24  - 1000206 1000207   255,0,0  24  96

#number of reads mapped
sum(data$V10)
#[1] 28218867

#density of methylation percent
plot(density(data$V11))
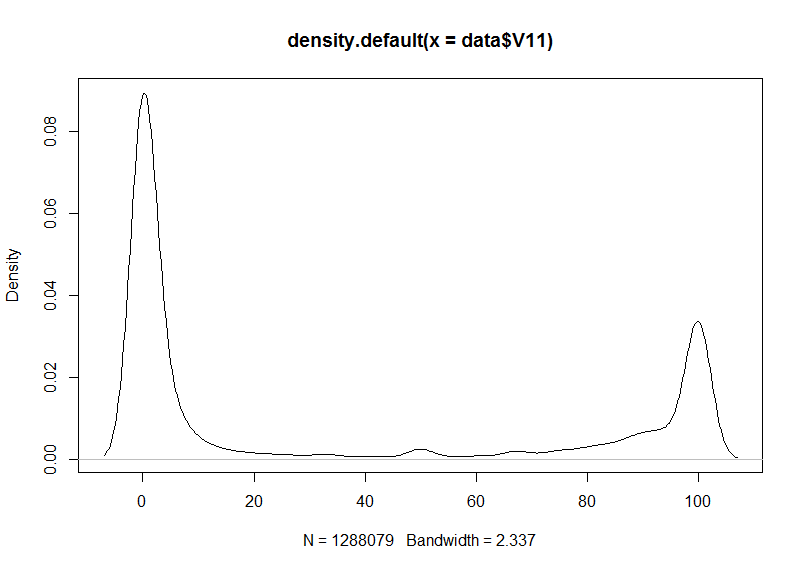 Bimodal distribution of methylation percentage in the H1ESC RRBS dataset.
And for the K562 cell line:
data <- read.table(gzfile("wgEncodeHaibMethylRrbsK562HaibSitesRep1.bed.gz"),
                   header=F,
                   skip=1)

#number of sites assayed
sum(data$V10)
[1] 45676252

plot(density(data$V11))
 Bimodal distribution of methylation percentage in the K562 RRBS dataset.
Distribution of mapped reads at each position:
h1 <- read.table(gzfile("wgEncodeHaibMethylRrbsH1hescHaibSitesRep1.bed.gz"),
                   header=F,
                   skip=1)

k562 <- read.table(gzfile("wgEncodeHaibMethylRrbsK562HaibSitesRep1.bed.gz"),
                   header=F,
                   skip=1)

#number of sites profiled
dim(h1)
[1] 1288079      11

dim(k562)
[1] 1275818      11

#distribution of read counts
quantile(h1$V10, probs=seq(0,1,0.1))
   0%   10%   20%   30%   40%   50%   60%   70%   80%   90%  100%
    1     1     2     4     8    12    18    25    35    53 18154

quantile(k562$V10, probs=seq(0,1,0.1))
   0%   10%   20%   30%   40%   50%   60%   70%   80%   90%  100%
    1     1     2     5    12    21    30    41    56    82 32552
Methylation status of CpG islands
Obtain CpG islands:
echo 'SELECT * FROM cpgIslandExt' |
mysql -B --user=genome --host=genome-mysql.cse.ucsc.edu hg19 |
grep -v "^bin" | awk 'OFS="\t" {print $2, $3, $4}' > hg19_cpg_island.bed

md5sum hg19_cpg_island.bed
2efe7d09742fbd7d5668dcd0c8d15db3  hg19_cpg_island.bed
Intersect with assayed sites in K562 and H1hesc:
intersectBed -a wgEncodeHaibMethylRrbsK562HaibSitesRep1.bed.gz -b hg19_cpg_island.bed -u | gzip > k562_rep1_cpg_island.bed.gz

#number of sites overlapping
zcat k562_rep1_cpg_island.bed.gz | wc -l
759650

#how many total
zcat wgEncodeHaibMethylRrbsK562HaibSitesRep1.bed.gz | wc -l
1275819

#percent of total overlapping CpG islands
bc -l<<<759650*100/1275819
59.54214508484353971840

#distribution of methylation percentage
zcat k562_rep1_cpg_island.bed.gz | cut -f11 | stats
Total lines:            759650
Sum of lines:           16809084
Ari. Mean:              22.1274060422563
Geo. Mean:              undef (zero found in data)
Median:                 1
Mode:                   0 (N=372779)
Anti-Mode:              49 (N=862)
Minimum:                0
Maximum:                100
Variance:               1207.24553825536
StdDev:                 34.7454391000511

#how with h1hesc
intersectBed -a wgEncodeHaibMethylRrbsH1hescHaibSitesRep1.bed.gz -b hg19_cpg_island.bed -u | gzip > h1hesc_rep1_cpg_island.bed.gz
zcat h1hesc_rep1_cpg_island.bed.gz | wc -l
795124
zcat h1hesc_rep1_cpg_island.bed.gz | cut -f11 | stats
Total lines:            795124
Sum of lines:           8410792
Ari. Mean:              10.5779626825501
Geo. Mean:              undef (zero found in data)
Median:                 0
Mode:                   0 (N=510970)
Anti-Mode:              66 (N=32)
Minimum:                0
Maximum:                100
Variance:               721.801261304316
StdDev:                 26.8663592863699
Methylation of regions upstream of RefSeq models
The upstream1000.fa.gz file contains sequences 1000 bases upstream of annotated transcription starts of RefSeq genes with annotated 5' UTRs.
wget http://hgdownload-test.cse.ucsc.edu/goldenPath/hg19/bigZips/upstream1000.fa.gz
zcat upstream1000.fa.gz | grep "^>" | cut -f2 -d' ' | sed 's/[:-]/\t/g' | gzip > upstream1000.bed.gz

intersectBed -a wgEncodeHaibMethylRrbsH1hescHaibSitesRep1.bed.gz -b upstream1000.bed.gz -u | gzip > h1hesc_rep1_upstream1000.bed.gz

intersectBed -a wgEncodeHaibMethylRrbsK562HaibSitesRep1.bed.gz -b upstream1000.bed.gz -u | gzip > k562_rep1_upstream1000.bed.gz

zcat h1hesc_rep1_upstream1000.bed.gz | wc -l
237219

zcat k562_rep1_upstream1000.bed.gz | wc -l
225752
Using the R package methylKit
Altuna has developed a R package called methylKit, which provides analytical tools for DNA methylation data from high-throughput bisulfite sequencing. He has written a post on using ENCODE methylation data in R, which I will follow here. The track line definition in the BED files causes a problem for the package, so we must first remove them:
zcat wgEncodeHaibMethylRrbsH1hescHaibSitesRep1.bed.gz | grep -v "^track" | gzip > h1hesc_rep1.bed.gz
zcat wgEncodeHaibMethylRrbsK562HaibSitesRep1.bed.gz | grep -v "^track" | gzip > k562_rep1.bed.gz
Now the analysis using R:
source("http://methylkit.googlecode.com/files/install.methylKit.R")
# installing the package with the dependencies
install.methylKit(ver="0.9.2",dependencies=TRUE)
library(methylKit)
file <- list("h1hesc_rep1.bed.gz",
"k562_rep1.bed.gz")
obj <- read(file,
sample.id = list("H1hesc", "K562"),
treatment = c(1,0),
assembly = "hg19",
header = FALSE,
context = "CpG",
resolution = "base",
pipeline = list(fraction = FALSE,
chr.col = 1,
start.col = 3,
end.col = 3,
coverage.col = 5,
strand.col = 6,
freqC.col = 11
)
)
obj
methylRawList object with 2 methylRaw objects
methylRaw object with 1288079 rows
--------------
chr start end strand coverage numCs numTs
1 chr1 1000171 1000171 + 41 34 7
2 chr1 1000191 1000191 + 41 33 8
3 chr1 1000192 1000192 - 24 18 6
4 chr1 1000199 1000199 + 41 40 1
5 chr1 1000200 1000200 - 24 22 2
6 chr1 1000207 1000207 - 24 23 1
--------------
sample.id: H1hesc
assembly: hg19
context: CpG
resolution: base
methylRaw object with 1275818 rows
--------------
chr start end strand coverage numCs numTs
1 chr1 1000171 1000171 + 46 16 30
2 chr1 1000191 1000191 + 46 7 39
3 chr1 1000192 1000192 - 53 5 48
4 chr1 1000199 1000199 + 46 9 37
5 chr1 1000200 1000200 - 53 8 45
6 chr1 1000207 1000207 - 53 14 39
--------------
sample.id: K562
assembly: hg19
context: CpG
resolution: base
treament: 1 0
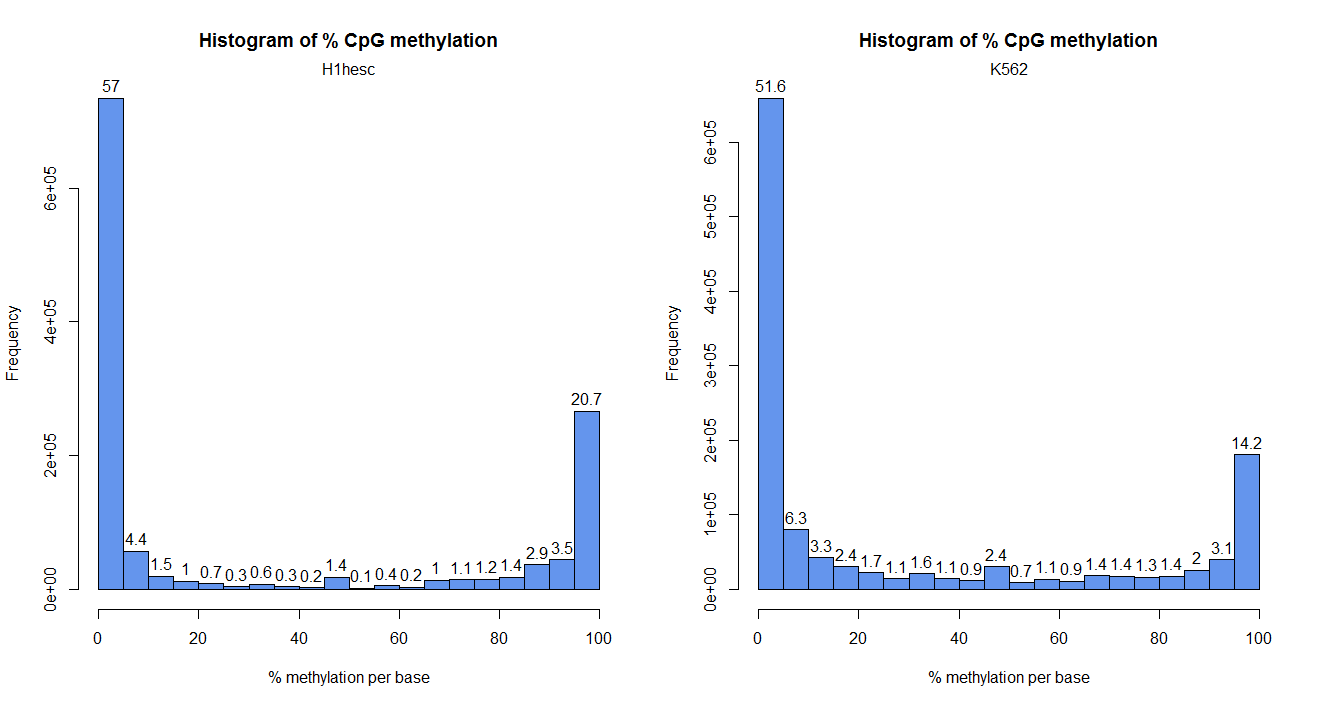
par(mfrow=c(1,2))
getMethylationStats(obj[[1]], plot = TRUE)
getMethylationStats(obj[[2]], plot = TRUE)
par(mfrow=c(1,1))
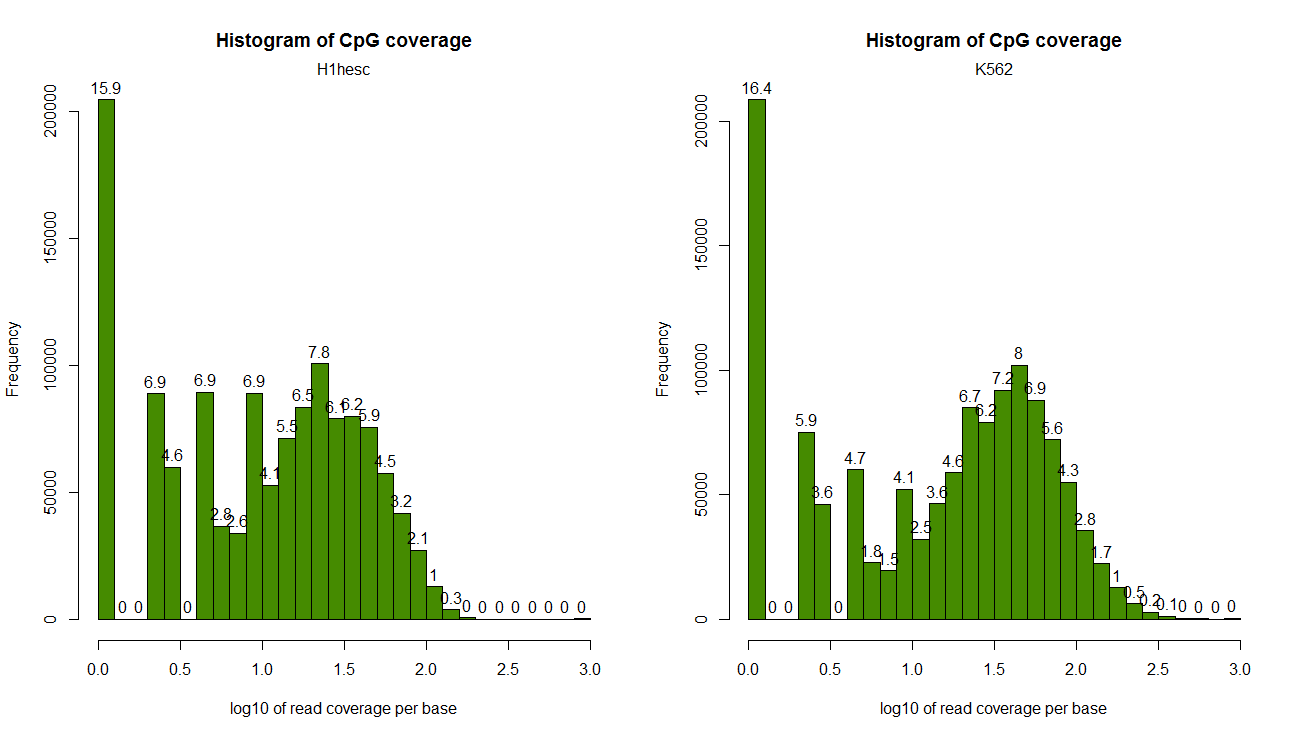
Read coverage per base:
par(mfrow=c(1,2))
getCoverageStats(obj[[1]],plot=T,both.strands=F)
getCoverageStats(obj[[2]],plot=T,both.strands=F)
Finding differentially methylated bases or regions
meth <- unite(obj, destrand=FALSE)
head(meth)
methylBase object with 6 rows
--------------
   chr  start    end strand coverage1 numCs1 numTs1 coverage2 numCs2 numTs2
1 chr1  88705  88705      +         3      2      1         3      2      1
2 chr1 137977 137977      +         2      2      0        35     33      2
3 chr1 137986 137986      +         2      2      0        35     28      7
4 chr1 713376 713376      +        11      9      2        35      9     26
5 chr1 713388 713388      +        11     10      1        35      6     29
6 chr1 713400 713400      +        11     10      1        35      2     33
--------------
sample.ids: H1hesc K562
destranded FALSE
assembly: hg19
context: CpG
treament: 1 0
resolution: base

myDiff <- calculateDiffMeth(meth, num.cores=16)
diffMethPerChr(myDiff, plot=F, qvalue.cutoff=0.01, meth.cutoff=25)
$diffMeth.per.chr
     chr number.of.hypomethylated percentage.of.hypomethylated
1   chr1                     9919                    10.308668
12  chr2                     8133                    11.563069
16  chr3                     4078                     9.178483
17  chr4                     3977                    10.153956
18  chr5                     5224                    11.946032
19  chr6                     4645                    10.341296
20  chr7                     5699                     9.715309
21  chr8                     4600                    10.528243
22  chr9                     4173                     8.453015
2  chr10                     5270                    10.879214
3  chr11                     5700                     9.891368
4  chr12                     3843                     8.331165
5  chr13                     2201                     9.940385
6  chr14                     3138                     9.737177
7  chr15                     4044                    12.907344
8  chr16                     3413                     5.869606
9  chr17                     7073                    10.330826
10 chr18                     2787                    12.794381
11 chr19                     5340                     6.728152
13 chr20                     3580                    10.135613
14 chr21                     1115                     6.548039
15 chr22                     3259                     9.583603
23  chrM                        0                     0.000000
24  chrX                     2326                     9.642650
25  chrY                        0                     0.000000
   number.of.hypermethylated percentage.of.hypermethylated
1                       9994                     10.386614
12                      7120                     10.122839
16                      3163                      7.119064
17                      4216                     10.764164
18                      4835                     11.056483
19                      4265                      9.495291
20                      6763                     11.529151
21                      4766                     10.908175
22                      5138                     10.407762
2                       5970                     12.324271
3                       5645                      9.795925
4                       3957                      8.578304
5                       2581                     11.656580
6                       2816                      8.738015
7                       2581                      8.237847
8                       6072                     10.442499
9                       5023                      7.336595
10                      2582                     11.853280
11                      5474                      6.896986
13                      3990                     11.296396
14                      2857                     16.778248
15                      3617                     10.636358
23                         0                      0.000000
24                      1617                      6.703424
25                       107                     36.518771

$diffMeth.all
  percentage.of.hypermethylated number.of.hypermethylated
1                      9.855018                    105149
  percentage.of.hypomethylated number.of.hypomethylated
1                     9.703934                   103537

Warning message:
In eval(expr, envir, enclos) : NAs introduced by coercion

#storing the results as a data.frame
data <- data.frame(chr=myDiff$chr, start=myDiff$start, end=myDiff$end, strand=myDiff$strand, pvalue=myDiff$pvalue, qvalue=myDiff$qvalue, diff=myDiff$meth.diff)
head(data)
   chr  start    end strand       pvalue       qvalue      diff
1 chr1  88705  88705      + 1.000000e+00 4.668054e-01  0.000000
2 chr1 137977 137977      + 1.000000e+00 4.668054e-01  5.714286
3 chr1 137986 137986      + 1.000000e+00 4.668054e-01 20.000000
4 chr1 713376 713376      + 1.471833e-03 3.660600e-03 56.103896
5 chr1 713388 713388      + 1.833536e-05 6.080518e-05 73.766234
6 chr1 713400 713400      + 1.691055e-07 7.280300e-07 85.194805

head(data[order(data$qvalue),])
          chr     start       end strand        pvalue        qvalue      diff
414424  chr17  31149809  31149809      - 2.363853e-222 5.886729e-217 -68.00000
414433  chr17  31149838  31149838      - 2.363853e-222 5.886729e-217 -68.00000
1066882  chrY  13489947  13489947      - 6.486169e-209 1.076839e-203  82.95817
802144   chr4 191003226 191003226      + 9.833213e-201 1.224388e-195  72.99165
1066803  chrY  13470831  13470831      + 3.185868e-197 3.173521e-192  87.06726
1066751  chrY  13462178  13462178      + 1.783279e-195 1.268834e-190  66.03226
Checking chr17:31149808-31149809 in the original files:
zcat h1hesc_rep1.bed.gz | grep chr17 | grep 31149809
chr17   31149808        31149809        SL716_RRBS      1000    -       31149808        31149809        55,255,0        6108    14
zcat k562_rep1.bed.gz | grep chr17 | grep 31149809
chr17   31149808        31149809        K562_Rep3_RRBS  1000    -       31149808        31149809        255,105,0       10775   82
We see that this site has the maximum read coverage, and differentially methylated (14% versus 82%) between h1hESC and K562 (hypomethylated in h1hESC).
See also
A Brief Guide to Reduced Representation Bisulfite-Seq


This work is licensed under a Creative Commons
Attribution 4.0 International License.
be careful when saying “K562 bisulfite sequencing data” — recall that K562 was only assayed for RRBS, unlike GM12878 and H1, which underwent whole-genome bisulfite sequencing. The latter is more informative when comparing to DHS peaks, etc. since it is not biased towards Msp/Hpa cut sites, which tend to reside in CpG-rich regions.
(a lot of tissue-specific methylation (or lack thereof) occurs outside these regions)
Hi Tim,
Thank you for making an important point. I can now appreciate why most of the sites I found were residing in CpG-rich regions. I will update this post later on and compare RRBS with WGBS data.
Thanks again!
Dave
Hi, please correct me if I’m misunderstanding something about this, but I’m not sure this bit does what you say it does:
My understanding is that the Encode RRBS data files contain every site to which reads were mapped, not just the ones that are methylated. So counting up all the lines in the file tells you how many sites were assayed in total, not how many of them were methylated. See [table schema](http://encodeproject.org/cgi-bin/hgTables?db=hg19&hgta_group=regulation&hgta_track=wgEncodeHaibMethylRrbs&hgta_doSchema=describe+table+schema) — it contains a column called “percentMeth”, and in the data files, many of these values are 0 indicating completely unmethylated positions.
Hi Bonnie,
Thanks for the comment; you are completely correct!
I will amend the post accordingly.
Cheers,
Dave
Hi Dave,
I just came across this page while searching for DNA methylation data. It is very nice to see that you documented the ENCODE DNA methylation data and its analyses so well. I have downloaded the .bed.gz files from “http://hgdownload.cse.ucsc.edu/goldenPath/hg19/encodeDCC/wgEncodeHaibMethylRrbs/” but could not open it. I tried using gunzip and tar but faliled. Can u plz suggest me how to open/extract this extension?
Hi Subhadeep,
how did you download the files and how are you trying to open the files?
Cheers,
Dave
I downloaded the file from “http://hgdownload.cse.ucsc.edu/goldenPath/hg19/encodeDCC/wgEncodeHaibMethyl450/”
the file name is “wgEncodeHaibMethyl450Gm12878SitesRep1.bed.gz”
I tried to open using wget command. tried to open by “gunzip” and “tar -xzvf” and got the message “gunzip: wgEncodeHaibMethyl450Gm12878SitesRep1.bed.gz: not in gzip format”. :/
sorry! i Tried to open using gunzip command. downloaded using wget.
The gunzip command will extract the file. For example, if you ran:
The file would now become wgEncodeHaibMethyl450Gm12878SitesRep1.bed. You can view the contents of this file by running:
yeah I tried that but this msg appears:
“gunzip: wgEncodeHaibMethyl450Gm12878SitesRep1.bed.gz: not in gzip format”.
may be the files are corrupted.
Anyway, thanks a lot.
Hi Dave,
When talking about 10X coverage, should I use score no less than 10 or #reads of that site no less than 10? Most of the time, they have the same value, but there does exist some sites with different values. I am not sure whether it works for both WGBS and RRBS.
Thanks,
Sam
Hi Sam,
the score column should be the same as count column and as far as I can remember, the coverage is calculated by the number of reads. I can’t advise on what threshold you should use. In wgEncodeHaibMethylRrbsK562HaibSitesRep1.bed.gz, the median read count was 21.
Cheers,
Dave