A Poisson distribution is the probability distribution that results from a Poisson experiment. A probability distribution assigns a probability to possible outcomes of a random experiment. A Poisson experiment has the following properties:
- The outcomes of the experiment can be classified as either successes or failures.
- The average number of successes that occurs in a specified region is known.
- The probability that a success will occur is proportional to the size of the region.
- The probability that a success will occur in an extremely small region is virtually zero.
A Poisson random variable is the number of successes that result from a Poisson experiment. Given the mean number of successes that occur in a specified region, we can compute the Poisson probability based on the following formula:
$$! P(x; \mu) = \frac{(e^{-\mu})(\mu^x)}{x!} $$
which is also written as:
$$! Pr(X = k) = e^{-\lambda} \frac{\lambda^k}{k!} \ \ k = 0, 1, 2, \dotsc $$
Examples
The average number of homes sold is 2 homes per day. What is the probability that exactly 3 homes will be sold tomorrow?
$$! P(3; 2) = \frac{(e^{-2}) (2^3)}{3!} $$
Calculating this in R:
e <- exp(1)
((e^-2)*(2^3))/factorial(3)
[1] 0.180447

#or simply
dpois(x = 3, lambda = 2)
[1] 0.180447
The Poisson distribution can be used to estimate the technical variance in high-throughput sequencing experiments. My basic understanding is that the variance between technical replicates can be modelled using the Poisson distribution. For more information check out this really useful discussion on Biostars.
Calculating confidence intervals
Calculate the confidence intervals using R:
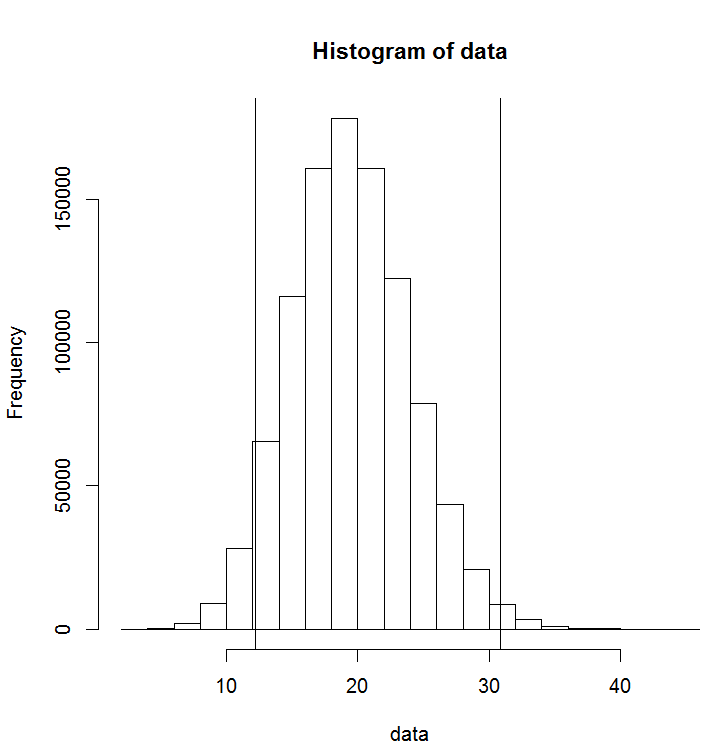
#store 1,000,000 values that follow a Poisson distribution
data <- rpois(1000000,20)
#functions for calculating the lower and upper tails
poisson_lower_tail <- function(n) {
   qchisq(0.025, 2*n)/2
}
poisson_upper_tail <- function(n) {
   qchisq(0.975, 2*(n+1))/2
}
#lower limit for lambda = 20
poisson_lower_tail(20)
[1] 12.21652
#upper limit for lambda = 20
poisson_upper_tail(20)
[1] 30.88838

#how many values in data are lower than the lower limit
table(data<poisson_lower_tail(20))

 FALSE   TRUE
960885  39115

#how many values in data are higher than the upper limit
table(data>poisson_upper_tail(20))

 FALSE   TRUE
986567  13433

#what percentage of values were outside of the 95% CI
(13433 + 39115) * 100 / 1000000
[1] 5.2548

hist(data)
abline(v=poisson_lower_tail(20))
abline(v=poisson_upper_tail(20))
Links
The Poisson Confidence Interval Calculator: http://www.danielsoper.com/statcalc3/calc.aspx?id=86


This work is licensed under a Creative Commons
Attribution 4.0 International License.